

By Robert Gioielli
Teaching the history of racism in America can be a difficult thing. Not because students deny it, but because it is something that is so ubiquitous, so all encompassing, that many (particularly white) students let the idea roll over and past them. They know racism existed in the past and people did racist things, but they have difficulty understanding how it changes over time, morphs and moves, taking on a different character and structure depending on time and place.
This makes any document, evidence, or concept that can explain racism and white supremacy so valuable in every American history classroom. Violence—of slavery, Jim Crow, and mass incarceration—is usually the easiest to illustrate and explain, because it’s the most horrific. It’s also because generations of Americans have been taught that racism is only about violence that stems from hatred, primarily from sneering Southern plantation owners and rednecks in white hoods. Racism is about bigoted interpersonal interactions, we are told, and thus rooted in our own morality. Structural racism, especially as it relates to American cities, can be more difficult to communicate. Census records that show neighborhood segregation, numbers and charts of arrest rates, or homeownership—all of these have been tabulated by generations of researchers eager to document and quantify the often-mundane world of structural inequality. This data is easy to compile in a handout or Powerpoint slide. But they are often best at showing the results of racist practices and not the policies themselves. And they don’t do the work of helping students understand the impact on individual lives, families, and communities.
But then you find the maps. The Homeowners Loan Corporation Residential Security maps (HOLC maps). They are racism and white supremacy in full 1930s, Wizard of Oz technicolor. Detailed and specific, all the more valuable because almost every major American city had one, and students can find places and neighborhoods they know, have lived in, had family from. For a scholar of twentieth-century United States history, especially one who researches and teaches urban and environmental history, the HOLC maps have long been a keystone slide in my teaching presentations, something to build out the entire lecture, unit, or even course. This is what structural racism means, when the state and its private-capital partners decide winners and losers, build generational wealth in one community, and condemn other groups to be starved of resources for decades.
I first started using HOLC maps in 2008, right out of graduate school. Google’s image search was relatively new, but it was easy to find scanned versions of the maps on various websites and depositories. They were always best paired with the actual HOLC research reports, which provided detailed descriptions of each neighborhood, justifying that investment was high risk because of “Negro incursion” or “low-class Italians.” They were also extraordinarily helpful for introducing the concept of “redlining,” the practice of denying mortgage credit to a community because of its racial and sometimes ethnic makeup. I always emphasized redlining originated before the 1930s and continued long after, but it became codified and federally sanctioned during the New Deal.
For about my first decade of teaching, redlining remained a specialist concept, something that students might only previously be familiar with if they had taken an urban sociology course. But then everything changed around 2014, when Ta-Nehisi Coates published “The Case for Reparations” in The Atlantic.[1] The primary goal of the piece was to expand the conversation about reparations to include housing discrimination, and it helped shed a bright light on practices like redlining, shadow mortgage markets, and contract buying. These and other concepts had been well-known to urbanists but had little traction outside certain academic and policy circles. Only a few months after that piece was published, the Ferguson protests erupted after the murder of Michael Brown, accelerating Americans’ new national search for origins of structural inequality. Within a year, my classes went from blank stares when I mentioned redlining, to a few nodding heads and raised hands from students who were familiar with the concept, with a few who had read Coates’s article. Three years later, Richard Rothstein’s The Color of Law, with a big, brightly-colored HOLC map right on the cover, became a bestseller, further popularizing the concepts and ideas of redlining.[2] Maybe the most powerful tool to explain redlining was the publication of Mapping Inequality, a sophisticated and interactive database of every known HOLC map, with thousands of corresponding neighborhood security reports for communities across the United States.[3] Attention to these resources surged in popularity again in 2020, as redlining became a powerful way for Americans to try to quantify and understand the history of the structural inequality that led to the murder of George Floyd and sparked a summer of protest and activism.
From the perspective of an urban and environmental historian who strives to communicate to colleagues, students, and my community, the social and ecological impact of decades of structural racism, the general ubiquity and common knowledge of the concept of redlining, especially as communicated through the HOLC maps, is tremendously valuable. It provides an entry point to challenging and complex discussions. But nevertheless, I wonder whether the concept, especially as communicated through these maps, has outlived its usefulness. Its simplicity and straightforward visual force have made it almost too powerful. The intervening decades of structural inequality and policy decisions since the 1930s have become hidden, blinding us to all the other ways that individual, corporate, and governmental decision making produces the highly-unequal metropolises many of us live in and contribute to today. I fear that it’s become too easy to blame the architects of this system from a century ago, putting black hats on hundreds of faceless and nameless bureaucrats. Through a process of trying to understand the origins of a key aspect of structural racism, have we actually moved backward and constructed a new moralistic story that obscures more than it illuminates?
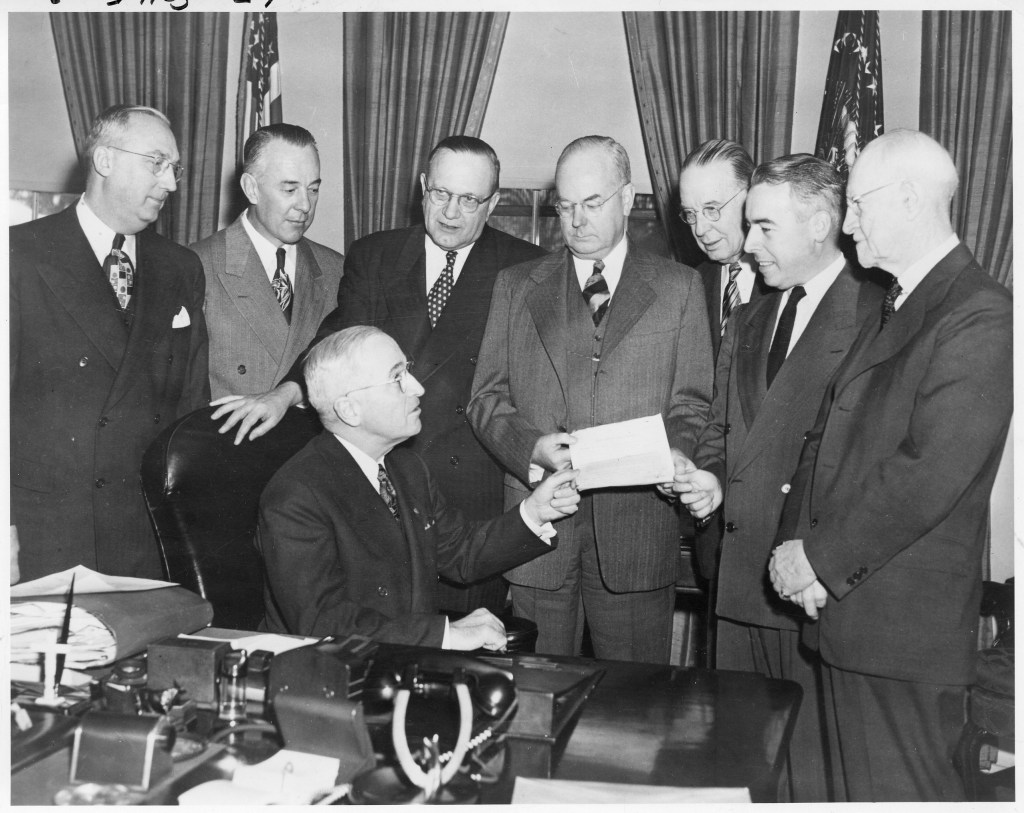
“President Truman Meets with Home Owner’s Loan Corporation” (1950), Harry S. Truman Presidential Library, National Archives.
The Problem of the Map
One of the most powerful aspects of the concept of redlining is that it was government sponsored. The Homeowners Loan Corporation (HOLC) was created in 1933 to directly support distressed homeowners and banks across the country, and it directly refinanced almost a million loans in its first three years of existence. As this “rescue” phase was winding down, the corporation began a nationwide attempt to calculate and grade mortgage risk in every major city in the country. This project produced hundreds of maps over the next few years. Government sponsorship meant that assiduous records were kept and codified, although they remained largely secret until the late 1970s, when they were discovered in the National Archives by historian Kenneth Jackson, who used them to make groundbreaking arguments about the role of federal policy in metropolitan development in his 1984 book Crabgrass Frontier: The Suburbanization of the United States. Since then, it has been widely acknowledged that the development of the HOLC maps marked the beginning of broader national policies that deprived investment from older, central-city communities populated by people of color and pushed it toward the newer—and whiter—suburbs. That this occurred under the auspices of the New Deal state, which was supposed to be designed to provide more economic justice for marginalized Americans and helped lay the groundwork for the Civil Rights Movement, forced a generation of historians to question and reformulate some of the bedrock assumptions of mid-century liberalism.[4]
But emphasis on the federal sponsorship of the HOLC maps and segregationist residential policy masks how local private actors in every American city fully endorsed, sponsored, and assisted with the design and implementation of redlining policies. Fifteen years ago David Freund detailed how the HOLC and other New Deal-era housing agencies were staffed, from the central office on down, by white real estate professionals who had developed thoroughly racialized ideas about property markets over the course of the 1920s.[5] More recently, Paige Glotzer has deepened this history by showing how private land developers shaped the form and function of the National Association of Real Estate Boards to make white racial exclusivity a core aspect of American real estate practice.[6] In a fascinating 2021 article, Todd Michney and LaDale Winling show, in painstaking detail, the intricate web of public and private actors that constructed racialized ideas about urban real estate markets in the 1910s and 1920s, cemented these into federal policy in the 1930s, and then spread them back through the real estate industry in the 1940s and 1950s—as redlining Johnny Appleseeds.[7] These important new perspectives help us understand that although the actions of the HOLC and other federal agencies in the 1930s were fundamental to making racialized property markets national policy, they were not cut from whole cloth in Washington, DC. They were the product of existing and dominant practices and ideologies in cities around the country.
Shifting our thinking doesn’t mean we let the federal government off the hook. On the contrary, our popular obsession with the HOLC map lets generations of local real estate agents, “hometown” banks, and property developers in every major American city off the hook. It lets every white family, including my own, that built generational wealth and privilege from housing segregation off the hook. Like much of the New Deal, housing policy was the product of significant negotiations between local and national actors, with federal officials usually deferring to local preferences, especially when it came to racial segregation. Reinserting this complexity into the story is important because a focus on the federal role oversimplifies, to a dangerous degree, local and private responsibility for residential segregation. This is one of the fundamental problems with Rothstein’s The Color of Law. By focusing on federal policy during the New Deal and afterward, Rothstein shifts our attention away from the reason why segregationist policies were put into place and remained difficult to root out: whites benefitted from them in numerous ways. The racialization of property markets: created a form of scarcity that boosted suburban property values; made it easier to execute urban renewal and highway construction projects in Black communities; and helped whites marshal public resources for their communities.[8] As helpful as The Color of Law was in popularizing the history of racist federal urban policy, it ultimately does little to force any sort of reckoning of how whites benefitted from these policies for decades and how federal practices institutionalized rather than generated them.
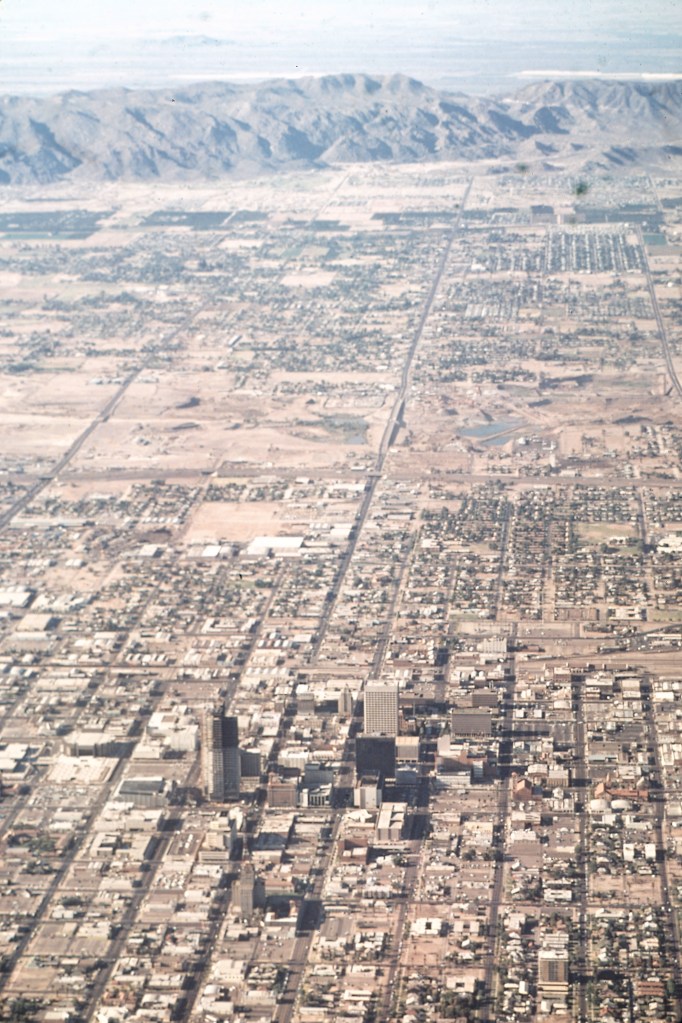
A view of Phoenix’s suburban sprawl in the early 1970s. The process of redlining created racialized property markets that shaped metropolitan areas far beyond historic municipal boundaries.
Cornelius Keyes, “The View of Phoenix’s Urban Sprawl” (1972) Documerica, Records of the EPA, National Archives.
The Redlining Vampire
While The Color of Law reinforces a leviathanesque interpretation of redlining as something imposed upon American society by the federal government during the New Deal, it does carry the historical narrative into the post-World War II period, examining other policies, such as zoning, urban renewal, and highway construction, that were destructive to Black communities and reinforced residential segregation. While Rothstein maintains an almost single-minded emphasis on the primacy of governmental action, especially at the federal level, he does admit that there were policies other than HOLC redlining that perpetuated and reinforced residential segregation.
This is not the case with a significant amount of other research that has appeared over the past several years. The popularity of the redlining concept, and particularly its specific depiction in the HOLC maps, has created a pernicious form of analysis that I call the “redlining vampire.”[9] Much like Dracula was undead and eternal, never growing or aging as he moved throughout history, within these narratives HOLC redlining practices never morph or change. The maps that were created in the 1930s seem to have a permanent, trans-historical impact on the American metropolis, shaping the lived experience of city residents all the way up to the present day.
These arguments first began to appear a few years back, when the HOLC maps would be used as a data point or argumentative buttress by journalists discussing historical or structural patterns of urban inequality. Although this reference would often annoy me, especially when done in a lazy, offhand way, as a former newspaper reporter, I chalked it up to the reality that journalists often have to collapse complex historical arguments into one or two sentences that tend to annoy us academics. And besides, I told myself, it was great that these issues were being discussed. The more articles on urban structural inequality, the better.
But much like Dracula moves across time, the redlining vampire has moved from journalistic crutch to core analytical premise in a host of recent social scientific publications. Because of the straightforwardness of their premise, “redlining in 1930s = contemporary problems,” many of these analyses have even transcended the walled garden of scholarly journals to be picked up by popular media. A recent publication in urban sustainability and environmental justice is a case in point. In “The Effects of Historical Housing Policies on Resident Exposure to Intra-Urban Heat: A Study of 108 US Urban Areas,” authors Jeremy Hoffman, Vivek Shandas, and Nicholas Pendleton explore a very important question: the origins and unequal impact of the urban heat island effect.[10] Global warming will increase the severity and frequency of summer heat waves, and it has been shown that these are strongest and have the biggest impact in poor urban neighborhoods, especially those with large communities of color. There are a multitude of reasons for this disparity, but the authors here are primarily interested in infrastructure, particularly an overwhelming amount of large buildings, roads, and sidewalks, which trap heat, and a lack of trees and parks, which have a cooling affect.
Their supposition is that historical redlining in the 1930s is the cause of hotter and deadlier urban neighborhoods today. Using the digitized HOLC maps from Mapping Inequality, they conduct a straightforward analysis that shows yes, the historically “redlined” communities are hotter, and the higher rated communities are generally cooler. The impact is greater in the South and West than in the Northeast and Midwest, but generally, if you live in a neighborhood that was redlined in 1940, it will be hotter, have less tree canopy, and include more impervious surface. Why was this so? Nodding to a few classics in urban history, they argue that the redlined mark of death for these neighborhoods led to more construction of large buildings, highways, and an underinvestment in parks, trees, and green space in the 1950s and 1960s. But in reality, the argument is quite simple: redlined in 1940, hotter (and more dangerous) in 2020.
After its initial publication in early 2020, the article received increased attention over the course of the year, especially as the intersecting crises of Black Lives Matter protests, West Coast wildfires, and a raging pandemic attuned more Americans to immediate and long-term issues of climate and health justice. The prominence of the research, then, makes it more important to dissect the problems and dangers of the redlining vampire. The first, and most obvious, issue is that although redlining was common during much of the twentieth century and still exists today, the HOLC maps are essentially just one example of this practice. The Federal Housing Administration (FHA) was actually much more important in shifting capital from cities to suburbs, but most of their housing security maps were destroyed, some believe by the Nixon administration in response to lawsuits over FHA mortgage discrimination.[11] Redlined neighborhoods morphed and changed constantly from the 1940s forward, as certain areas gentrified and others, which had been safe investments during the Great Depression, were considered “in decline” after the twin sucker punches of deindustrialization and urban disinvestment in the 1970s and 1980s. Second, although federal policy was very important when it came to redlining, private banks and lending institutions mattered just as much, following their own practices during this period. HOLC maps are popular among historians because, despite their drawbacks, they make visible what millions of city residents and activists encountered during much of the twentieth century: when you walked into a bank, your skin color and the location where you wanted to purchase a home were just as important to whether or not you were issued a mortgage as your actual ability to pay or the quality of the house. In other words, despite the adage that real estate is all about “Location! Location! Location!” who you were—and not what you could pay—mattered to local lenders eighty years ago, and it still matters today.
This urban heat island article is just one example of the speed with which the redlining vampire has made itself at home within urban studies literature over the past few years, shaping everything from discussions of cancer and poverty rates to the structure of the built environment and long-term health outcomes.[12] Almost all studies are built upon the digitized maps from the University of Richmond and make similar conclusions: a community that was “redlined” in the 1930s has greater evidence of a host of negative public health outcomes and environmental issues today. A detailed reading of any of these articles shows the appropriate amount of scholarly rigor and qualification, as well as conclusions that point the way toward further research. For example, the recent article “Historical Redlining Is Associated with Present-Day Air Pollution Disparities in U.S. Cities” shows how some of the most interesting disparities in levels of pollution are within historically “redlined” communities, and even admits that some of the results “suggest redlining disparity effects are one of multiple factors that contribute to intraurban racial/ethnic disparities in pollution exposure.”[13] Nevertheless, the article headline connects redlining and air pollution, and most importantly, so did the significant number of news reports that picked up the research soon after its release. “Even many decades later, redlined areas see higher levels of air pollution,” the headline on NPR’s website said. “Redlining means 45 million Americans are breathing dirtier air, 50 years after it ended,” claimed a similar article by Darryl Fears in the Washington Post.
These and other articles that discussed the air pollution research were not just cherry-picking from academic headlines. Fears’s piece is particularly detailed, providing a straightforward but never simplistic summary of the article, explaining the different types of air pollution measured and connecting it to contemporary environmental issues. Nevertheless, the basic takeaways from the article continue to give life to the redlining vampire—the bureaucrats of the 1930s are the undead that continue to create the destructive inequalities of our contemporary cities. “The decisions and the actions we’re talking about were made by people who are no longer alive, and yet we’re suffering the consequences of this structural, race-based planning,” one of the study’s authors, Julian Marshall, is quoted of as saying in the article.[14] What’s the better move here? At the minimum, we need to be clear that many of these contemporary issues are a legacy of redlining, which set in motion scores of other policies and practices that can be equally as important when explaining a problem such as air pollution. But we also need to develop improved models for understanding the complex development and impact of racialized property markets since the 1950s. And we must reckon with why we are so comfortable placing all of the blame for contemporary inequality on actors and policies that are almost a century old.
Because home value has become such an important part of wealth building in modern America, the HOLC security maps are especially popular within economics research. Many recent projects engage in sophisticated forms of quantitative analysis and have some interesting conclusions, but still end up falling into analytical traps that actually reinforce outdated assumptions about race and inequality. A recent working paper, “Race, Risk, and the Emergence of Federal Redlining” by Price V. Fishback, Jessica LaVoice, Allison Shertzer, and Randall Walsh, is an excellent example.[15] The authors engage in a nuanced and complex analysis of both the HOLC security maps and the original narrative surveys and reports most of the maps were based on. The inclusion of the surveys is key, because they contained a significant amount of demographic data and allow the authors to compare HOLC data to census records from 1930 and 1940.
One of the key conclusions of the article is that a series of statistical calculations provide clear evidence that HOLC security ratings were not made with racial intent. “Our findings support the notion that the HOLC maps reflected fundamental and longstanding disparities between Black and white neighborhoods rather than having targeted black neighborhoods for the lowest security grade.” These disparities, they argue, were because of discriminatory lending and sales practices within the private market in the decades before the Great Depression, which continued after the 1930s. There are numerous analytical and logical problems with this argument. The most obvious is that despite any evidence (or lack thereof) of racial intent, it is universally acknowledged that the HOLC security maps reinforced and institutionalized to a significant degree existing racist practices.[16] The authors argue that if they were racist, then evidence should have shown up in the 1940 census records. But a true long-term analysis needs to look at neighborhood trajectories over decades, especially considering how the massive infusion of postwar capital fundamentally reshaped cities. Second, is that although the federal intervention into the residential credit and capital markets during the 1930s was massive and transformative, to assume that every decision made before the New Deal was the result of somehow-independent market forces is to also ignore massive evidence of how state actors, primarily at the local level, significantly shaped urban development in the first part of the twentieth century.
The final issue is perhaps the most important. According to the authors, their analysis leads them to conclude that “the maps exhibit little evidence of explicit racial bias.” This is problematic both on its face and when considered from a more conceptual perspective. The strength of this article is that instead of just using the maps, it also analyzes data from the 30,000 plus survey reports that helped create the maps. But there is no analysis of the narrative text in the surveys. Although these vary in their level of description (Cleveland’s are particularly rich, for example, while those for Baltimore are sparse) they are dripping with racial thinking and assumptions, primarily that the presence of Black people in a neighborhood equals low housing values. You don’t get more racist than that. But beyond that is the authors’ assumption that because these neighborhoods were already in decline, the folks who wrote the reports were just making an accurate analysis of housing value. The argument essentially becomes: there is no evidence of HOLC surveyors consciously placing Black communities that did not already have a low value in the lowest grade of “D,” so thus there can’t be racial bias. This ignores the reality that value was already being racialized in American real estate practice and in emerging “ecological” ideas about the city. Thus, the very idea of decline was connected to race. After deploying a host of complex statistical tools built on reams of data, the authors have a simplistic view of race, which sees it as an independent variable disconnected from the market, and believes racist acts are only the result of explicit racial intent. This is what we might call the “guys in white hoods” or “Snidely Whiplash” school of racism—that it only exists when we clearly see the individual animus. But we know that is not the case. Racism exists in a variety of forms and is perpetrated and reinforced through all different types of actions and decisions.
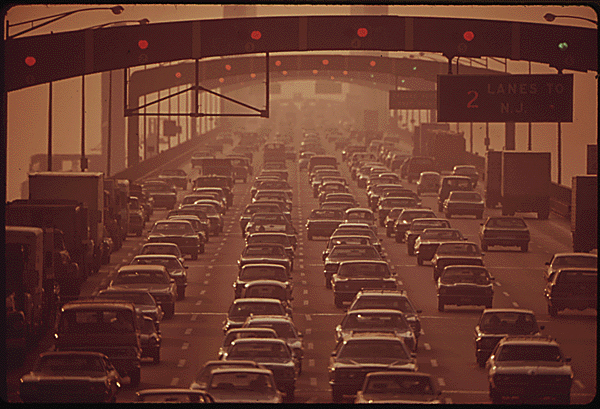
The restriction of mobility, by opposing mass transit and privileging automobility, was a key part of white efforts to maintain white suburban privilege after the end of the redlining in the 1970s.
Dick Swanson, “Walt Whitman Bridge Crosses the Delaware River at South Philadelphia, Leads to New Jersey Suburbs” (1973), Documerica, Records of the EPA, National Archives..
More than the Map
The analytical problems posed by this research result from a fundamental misunderstanding of redlining. It was not a static set of maps set in stone during the New Deal but a constantly-evolving suite of policies and practices involving multiple public and private actors and institutions at the national and local level. It also thoroughly over-determines New Deal era redlining as the fundamental root cause of contemporary metropolitan inequality, overlooking both decades of racialized investment before the 1930s and another half century of racial policy making that emerged after redlining’s demise.
One of the most seductive aspects of the HOLC maps and research reports is the sheer amount of data they represent, which is attractive to many social scientists whose primary research is based on data analysis. But whereas an economist (like Fishback, et al.) might assume uniformity in the data set, a historian asks “where did those numbers come from?” That’s what Todd Michney does in “How the City Survey’s Redlining Maps Were Made: A Closer Look at HOLC’s Mortgagee Rehabilitation Division,” which is based on a huge cache of memos and letters between the administrators of the HOLC City Survey and their local agents. What Michney found is that far from being some sort of massive, coordinated conspiracy to shape the racial geography of metropolitan America, the City Survey was often an underfunded, improvised, haphazard endeavor based on inconsistent survey methods. In one city HOLC officials might talk to dozens, if not hundreds, of real estate experts, and in another they depended on just a handful. The maps themselves went through multiple iterations, with disagreements over how to classify and map various neighborhoods. They were the result of complex and inconsistent negotiation between thousands of actors, not the decree of one authoritative government bureaucracy.[17]
Were those HOLC officials almost all middle-class white men, who followed the assumptions of their time in regard race and real estate? Incontrovertibly. And did their maps have an impact on similar research being done at the FHA? To this more contentious point, Michney also answers yes. And it’s the FHA that we know is the most important agency here. Despite the racist assumptions of the City Survey, there is no evidence it directly guided HOLC policy. In its “rescue” phase, the corporation actually gave loans to Black homeowners at percentages consistent with their population in almost every city. It was FHA policy in the immediate postwar decades that clearly discriminated against Black and central-city communities, almost always preferring to subsidize new development in White suburban communities.
This, of course, is what made FHA policies the target of fair-housing community activists the 1960s and 1970s. They had no maps or big data sets, but they knew that federal agencies would not insure mortgages in large swaths of major American cities. This included almost all neighborhoods with a majority of Black or Hispanic residents, but also many poor and working-class White communities. This lack of federal support meant most standard lending agencies refused to serve these neighborhoods, leading to major disinvestment, speculation, and exploitive realtors who sold homes on usurious “ground rent” or contract-buying schemes.
The tide turned on redlining at the end of the 1960s. Beginning with the Fair Housing Act and Housing and Urban Development Act, both passed in 1968, and continuing with the Community Reinvestment Act of 1977, federal policy worked to end redlining and other forms of housing discrimination to open up the suburbs—and homeownership—to people of color. Tens of thousands of activists, families, and individuals worked to make these policies real on the ground through actions as simple as purchasing homes in White neighborhoods and filing decades-long lawsuits to open up the suburbs to public housing projects. In response to this, metropolitan Whites developed a range of new practices to maintain residential segregation. Zoning law, which had long been used to keep out “undesirables,” morphed and changed to exclude apartments, townhomes, and any form of density that could make suburban communities more affordable, and thus more accessible to people of color.[18] White suburban communities rigidly opposed all forms of social housing, leading to legendary integration fights in Chicago, Philadelphia, and New York, which dragged on for decades.[19] The emerging environmental movement also played a role. New laws and policies to encourage the preservation of green space allowed suburban communities to place large tracts of land under conservation easements, entirely restricting new development, driving up home values, and further limiting accessibility.[20] When discussing these policies and practices, white suburbanites would use the language of preserving community character, but embedded directly within that was the goal of restricting the broad metropolitan mobility of racial minorities, particularly African Americans. But the restriction of daily mobility was vital as well. White suburbanites opposed the extension of metropolitan public transit into their communities at every turn, using a new racial language of crime, which successfully connected older anxieties with new fears of the crack epidemic and war on drugs in the 1980s.[21]
In order that they could withstand legal challenges, all of these policies were designed to appear to be race neutral, preserving the ever-vague “character of the community.” But their impact has been fundamentally racial, helping to drive the sprawling, vastly-unequal patchwork that is the contemporary American metropolis. Major sections of American suburbia are still walled off to Black families, while other previously all-White suburbs have become majority Black and suffer the same community effects of white flight and disinvestment that central-city neighborhoods felt half a century ago.[22] The policies that shape the current city are directly descended from redlining, but in ways that much of the public discourse and research does not fully understand. Redlining was not just that these policies assigned grades—and thus targeted investment and disinvestment—for certain neighborhoods. The importance of redlining is how it was part of a suite of policies that racialized metropolitan property markets, especially for residential property. Such entrenched dynamics continued to play out over the course of the twentieth and twenty-first century, and were either immune to various policy interventions or adopted themselves to them. The story that Keeanga Yamahtta-Taylor tells in Race for Profit is a case in point. After the Fair Housing and HUD acts of 1968, new programs were created to try and ostensibly bring low-income Americans into the private homeownership market. But on the ground, within racialized housing markets, these policies actually made things worse for those they were supposed to benefit. Poor Black women, especially, were exploited for the benefit of private real estate brokers, developers, and contractors and then were blamed for the failure of the program.[23]
We have a lot of work to do to understand the depth, breadth, and impact of the racialization of housing and credit markets over the course of the twentieth century, and especially since the 1970s.[24] Housing vouchers, the low-income housing tax credit, education policy, the financialization of mortgage markets, and myriad other practices have all shaped who can live where, who can build wealth from their home, and who lives in a neighborhood that is safe and clean with good schools and positive life outcomes.[25] Every piece of the American metropolis, from the downtown skyscraper to the exurban McMansion, is part of a thoroughly racialized landscape, a palimpsest of redlining, mortgage deductions, zoning laws, road subsidies, and exploitive credit practices, all of which have layered together to inscribe race into every part of the city-building process.
But didn’t redlining really matter, you may ask? Didn’t it play a major role in shaping race and space in our cities? Yes, to the degree that the practices and policies that produced those HOLC maps are arguably the wellspring for all of these other racial practices and policies. But to focus on the maps and to use them as the primary data set in our analysis of why a particular neighborhood is too hot, too poor, and too crime ridden, is to not only to make a scholarly miscalculation that fails to get us close to an accurate picture of the causes of contemporary racial inequalities. It’s also to let ourselves off the hook for the hundreds of different local, state, and national policies, enacted from 1940 all the way up to the present, and all of the everyday decisions we, as individuals, make about where to live, where to send our kids to school, how we commute, and who gets to live in our neighborhood, that perpetuate and reinforce racial inequality, making us coperpetrators of structural racism. It is primarily whites who are and have been responsible for this, but we all need to pay attention to the complex mix of personal decision and public policy that has created our vastly-unequal cities.
One of the biggest challenges any scholar or educator who wants to help their students and community understand race in America faces is moving past the idea of racism as solely a moral issue. This one is tough, because was have been taught for decades to only consider racism as an issue of personal morality. Despite the power of Martin Luther King Jr.’s oratory and message on the economic and political structures of racism, we only remember the moral lessons. When we find a tool that shows how it’s not just about having hate in your heart, but benefitting structurally from the advantages of Whiteness, we want to grab onto it and use it in whatever context possible. I have used the concepts of redlining and HOLC maps in almost every history course I have ever taught that discusses twentieth-century America. They are powerful. But they can also result in a conceptual inversion, whereby the attempt to tell a structural story actually becomes a moral one. The world that produced redlining becomes simply another world, in the past, where people were immorally racist, made immorally-racist decisions, and enacted immorally-racist policies; in other words, not the world—or country—we live in today.
Maps can be powerful sources. They allow us to make immediate connections to places we might know and be familiar with, and they also make it easy to communicate our points to students or a public audience. But maps can flatten and simplify complex stories. The HOLC maps are an immediate visual representation of a seductive narrative: “See here? This is how the federal government f$#&ed up American cities!” It is an easy declension narrative: Redlining => Urban renewal and highway construction => Public housing => Every crappy thing that has happened in cities in the past century. This implied, totalizing perspective is one of the challenges of maps as historical sources, since they are often produced by governments, agencies, or institutions that look to control, manage, and shape a particular place, often in highly-unequal ways. And the goal of the HOLC maps was no different. But the reality is that for any given city there was not just one map, but many maps, produced by the Federal Housing Administration, local government planners, bank officials, mortgage company executives, and savings and loan presidents. These were often similar to the HOLC maps, but they also changed significantly over time. And maps also erase the stories of thousands of people on the ground, like Clyde Ross and others who formed the Contract Buyers League in Chicago, or Ivory Perry and other housing activists in St. Louis, people who fought against disinvestment and redlining, and still managed to produce real community, despite the profound disadvantages of being in a “Grade D” community. They completely leave out the stories and experiences of suburban activists, like Ethel Lawrence, who fought for decades to have affordable housing built in her hometown of Mount Laurel, New Jersey, a suburb of Philadelphia.[26] In short, the HOLC maps provide a historical snapshot of a community at one place in time, but they are not destiny.
As scholars, writers, and urban experts, we owe it to those historic city residents, as well as the current ones fighting against the contemporary challenges of gentrification, police brutality, and environmental racism, to not flatten their stories and to communicate this complexity to policymakers, scholars in other disciplines, and the public. A discussion of redlining is not an end point, but an entry point to exploring all of the complex ways that structural inequalities developed over the course of the twentieth and twenty-first centuries and are currently shaping our metropolitan communities—not only by perpetuating disadvantage in some places, but also by creating places that many of us benefit from. We also need to confront the reality that the map isn’t what’s making decisions—it’s all of us.
Special thanks to Dawn Biehler, Emily Gioielli, Kara Schlichting, and the editors of The Metropole for their comments, suggestions ,and insights on various versions of this essay.

Rob Gioielli is professor of history and environmental studies at the University of Cincinnati Blue Ash College, where he also directs the college’s honors program. He is the author of Environmental Activism and the Urban Crisis: Baltimore, St. Louis, Chicago (Temple, 2014). He is currently working on an environmental history of white flight, under contract with University of Washington Press in the Weyerhauser Environmental Books series. @robgioielli
Featured image (at top): HOLC map, Chicago, IL, between 1932 and 1940, courtesy of Mapping Inequality.
[1] Ta-Nehisi Coates,“The Case for Reparations,” The Atlantic, July 2016.
[2] Richard Rothstein, The Color of Law: A Forgotten History of How Our Government Segregated America, (New York: Liveright Publishing Corporation, 2017).
[3] Robert K. Nelson, LaDale Winling, Richard Marciano, Nathan Connolly, et al., “Mapping Inequality,” American Panorama, ed. Robert K. Nelson and Edward L. Ayers, accessed March 12, 2021, https://dsl.richmond.edu/panorama/redlining/. For an excellent essay explaining the larger conceptualization and context of the project, see “Mapping Inequality: ‘Big data’ Meets Social History in the Story of Redlining,” N. D. B. Connolly, LaDale Winling, Robert K. Nelson, and Richard Marciano in The Routledge Companion to Spatial History, eds. Ian Gregory, Don DeBats, Don Lafreniere (New York: Routledge, 2018).
[4] On race and New Deal Liberalism, see especially Gary Gerstle, American Crucible: Race and Nation in the Twentieth Century (Princeton, NJ: Princeton University Press, 2017); Thomas J. Sugrue, The Origins of the Urban Crisis: Race and Inequality in Postwar Detroit (Princeton Classics) (Princeton, NJ: Princeton University Press, 1996).
[5] David Freund, Colored Property: State Policy and White Racial Politicsin Suburban America (Chicago: University of Chicago Press, 2010).
[6] Paige Glotzer, How the Suburbs Were Segregated: Developers and the Business of Exclusionary Housing, 1890-1960 (New York: Columbia University Press, 2020).
[7] Todd M. Michney and LaDale C. Winling, “The Roots of Redlining: Academic, Governmental, and Professional Networks in the Making of the New Deal Lending Regime,” Journal of American History 108, no. 1 (Jun. 2021): 42-69.
[8] Destin Jenkins, “Who Segregated America,” Public Books, Dec. 21, 2017. https://www.publicbooks.org/who-segregated-america/.
[9] I borrow the idea of a conceptual vampire from Sundiata Keita Cha-Jua and Clarence Lang, “The ‘Long Civil Rights Movement’ as Vampire: Temporal and Spatial Fallacies in Recent Black Freedom Studies,” The Journal of African American History 92, no. 2 (Spring, 2007): 265-288.
[10] Jeremy S. Hoffman, Vivek Shandas, and Nicholas Pendleton, “The Effects of Historical Housing Policies on Resident Exposure to Intra-Urban Heat: A Study of 108 US Urban Areas,” Climate 8, no. 1 (January 2020).
[11] Todd M. Michney and LaDale Winling, “New Perspectives on New Deal Housing Policy: Explicating and Mapping HOLC Loans to African Americans,” Journal of Urban History 46, no. 1 (January 1, 2020): 150–80; Lynne Beyer Sagalyn, “Housing on the Installment Plan : An Economic and Institutional Analysis of Contract Buying in Chicago” (Ph.D. Dissertation, Massachusetts Institute of Technology, 1980).
[12] See for example Brian An, Anthony W. Orlando, and Seva Rodnyansky, “The Physical Legacy of Racism: How Redlining Cemented the Modern Built Environment,” SSRN Scholarly Paper (Rochester, NY: Social Science Research Network, September 1, 2019), https://doi.org/10.2139/ssrn.3500612; Nancy Krieger et al., “Cancer Stage at Diagnosis, Historical Redlining, and Current Neighborhood Characteristics: Breast, Cervical, Lung, and Colorectal Cancers, Massachusetts, 2001–2015,” American Journal of Epidemiology 189, no. 10 (Oct. 1, 2020): 1065–75; Jacob Krimmel, “Persistence of Prejudice: Estimating the Long Term Effects of Redlining” (SocArXiv, Mar. 1, 2018); Anthony Nardone, Joey Chiang, and Jason Corburn, “Historic Redlining and Urban Health Today in U.S. Cities,” Environmental Justice 13, no. 4 (July 29, 2020): 109–19; Ian Appel and Jordan Nickerson, “Pockets of Poverty: The Long-Term Effects of Redlining,” SSRN Scholarly Paper (Rochester, NY: Social Science Research Network, October 15, 2016); M. Li and F. Yuan, “Historical Redlining and Resident Exposure to COVID-19: A Study of New York City,” Race and Social Problems, 14, (2022):85-100, https://doi.org/10.1007/s12552-021-09338-z.
[13] Haley M. Lane, Rachel Morello-Frosch, Julian D. Marshall, and Joshua S. Apte, “Historical Redlining Is Associated with Present-Day Air Pollution Disparities in U.S. Cities,” Environmental Science & Technology Letters 9, no. 4 (2022): 345-350.
[14] Laurel Warmsley, “Even Many Decades Later, Redlined Areas See Higher Levels of Air Pollution,” npr.org, Mar. 10, 2022. https://www.npr.org/2022/03/10/1085882933/redlining-pollution-racism; Darryl Fears, “Redlining Means 45 Million Americans Are Breathing Dirtier Air, 50 Years after It Ended,” Washington Post, Mar. 9, 2022. https://www.washingtonpost.com/climate-environment/2022/03/09/redlining-pollution-environmental-justice/
[15] Price V. Fishback, Jessica LaVoice, Allison Shertzer, and Randall Walsh, “The HOLC Maps: How Race and Poverty Influenced Real Estate Professionals’ Evaluation of Lending Risk in the 1930s,” NBER Working Paper no. w28146, Nov. 2020. https://ssrn.com/abstract=3739643
[16] Freund, Colored Property.
[17] Todd Michney, “How the City Survey’s Redlining Maps Were Made: A Closer Look at HOLC’s Mortgagee Rehabilitation Division,” Journal of Planning History 21, no. 4 (Nov. 2022): 316-344.
[18] Michael Danielson, The Politics of Exclusion (New York: Columbia University Press, 1976).
[19] Douglas Massey, et al. Climbing Mount Laurel: The Struggle for Affordable Housing and Social Mobility in an American Suburb (Princeton, N.J.: Princeton UP, 2013); Alexander Polikoff, Waiting for Gautreaux: A Story of Segregation, Housing, and the Black Ghetto (Chicago: Northwestern University Press, 2006).
[20] Mike Davis, City of Quartz: Excavating the Future in Los Angeles (London: Verso, 1991); James Duncan and Nancy Duncan, Landscapes of Privilege: The Politics of the Aesthetic in an American Suburb (New York: Routledge Press, 2004); Lily Geismer, Don’t Blame Us: Suburban Liberals and the Transformation of the Democratic Party (Princeton, NJ: Princeton University Press, 2014).
[21] William Schmidt, “Racial Roadblock Seen in Atlanta Transit System: The Agency’s Head Says Fear of Blacks Is Keeping Two Counties from Joining.” New York Times, July 22, 1987.
[22] Scott W. Allard, Places in Need: The Changing Geography of Poverty, (New York: Russell Sage Foundation, 2017); Bernadette Hanlon, Once the American Dream: Inner-Ring Suburbs of the Metropolitan United States (Philadelphia, PA: Temple University Press, 2009).
[23] Keeanga-Yamahtta Taylor, Race for Profit: How Banks and the Real Estate Industry Undermined Black Homeownership, Justice, Power, and Politics (Chapel Hill: University of North Carolina Press, 2019).
[24] For an excellent discussion of the relationship between markets and race, see David Imbroscio, “Race matters (even more than you already think): Racism, housing, and the limits of The Color of Law,” Journal of Race, Ethnicity and the City 2, no. 1 (2020): 29-53.
[25] Alicia Mazzara and Brian Knudsen, “Where Families With Children Use Housing Vouchers: A Comparative Look at the 50 Largest Metropolitan Areas,” Center on Budget and Policy Priorities: Poverty and Race Research Action Council, Jan. 3, 2019. https://www.cbpp.org/research/housing/where-families-with-children-use-housing-vouchers; John N. Robinson III, “Fair Housing After “Big Government: How Tax Credits Are Reshaping the Legal Fight Against Racial Segregation,” Housing Policy Debate 29, no. 5 (2019): 752-768; Rebecca Marchiel, After Redlining: The Urban Reinvestment Movement in the Era of Financial Deregulation (Chicago: University of Chicago Press, 2020).
[26] George Lipsitz, Ivory Perry: A Life in the Struggle (Philadelphia, PA: Temple University Press, 1995); Beryl Satter, Family Properties: Race, Real Estate, and the Exploitation of Black Urban America, (New York: Metropolitan Books, 2009); Coates, “The Case for Reparations”; Massey, et al. Climbing Mount Laurel.

Where can I find the research reports that accompanied the maps?
LikeLike
Excellent question. Mapping Inequality actually included the reports on their site. Click on a city you are interested in, then a part of the HOLC map. You can then see the report on the right, both transcribed or the original scan. https://dsl.richmond.edu/panorama/redlining/
LikeLiked by 1 person
Thank you, this is a big help! Am I correct that to get the reports for an entire city, I need to click on each colored zone on the map?
LikeLike
Those are the reports for each “zone.” I don’t know if there are aggregate reports for each city. I would see Todd Michney’s article, referenced above.
LikeLike
How do I find a specific map of a small town? Palo Alto CA 94306 in Santa Clara Co.
LikeLike
Thank you for this useful analysis. Merely because we found these HOLC maps in the National Archives, we have opportunistically retrofitted an evil act to them that they played virtually no role in. It’s as if the jealous wife has been charged with murder because a derringer was found in her purse—even though the cheating husband died of a heart attack.
LikeLike
I am working on a definitive attempt at a roll around in the mud with the disingenuous Christopher Rufo (of invented CRT disinformation fame). All of the resources contained in this post are invaluable! Thank you so much for your work (now that I know about you — compliments of a Boingboing link this morning!).
LikeLike
Has anyone written a thorough and well-documented history of the term “redlining?” In this article, the meaning of the term seems to evolve over time. Further, it’s not clear whether HOLC employees used the term. Who coined the term? When? Did others add (or subtract) dimensions to the original definition? When and why? The nuance matters.
LikeLike
Since I am on hold waiting for customer service, I did an Google Ngram. This doesn’t tell you who coined it, but when it gained currency & popularity. Screenshots are apparently now allowed so here is the search string:
https://books.google.com/ngrams/graph?content=redlining&year_start=1800&year_end=2019&corpus=en-2019&smoothing=3
LikeLike